The county saw most of its population growth from 1960 to 1980. The population has slightly declined since 1980 and it is projected to decline even further by 4%. The county is committed to offset the declining population trend through initiatives such as the “40 by 30” to focus on increasing the population to 40,000 people by the year 2030. the plan will also develop policies to retain younger population and attract more people to live in Pulaski County.
Data Infographics
Population
Population Estimate as of 2016
34,417
By 2045, Population is projected to descrease by 4%
According to Weldon Cooper Center
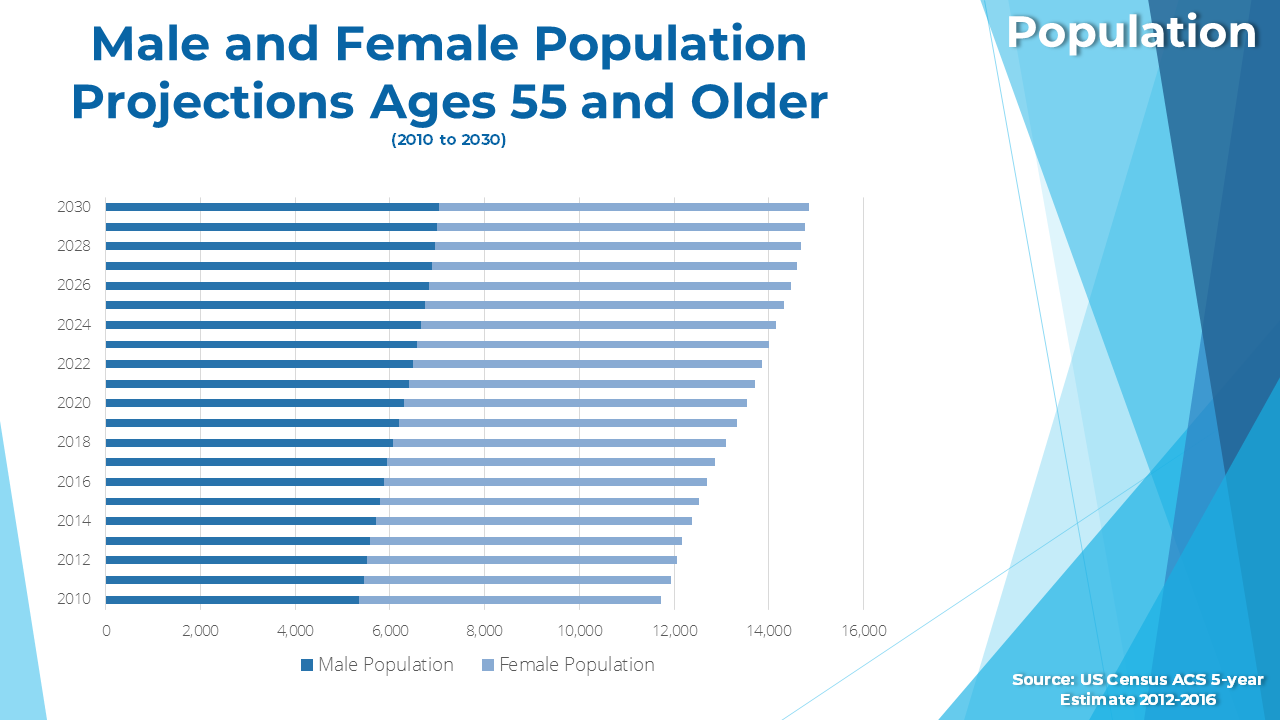
Due to the increasing trend of aging population, the County will need to consider increasing housing options, improving social wellbeing, and alleviating mobility restrictions for seniors citizens.
17,147
17,270
Population 65 Years and over
20.7%
Education
84.1%
Percent of Population that are High School Graduates or Higher
18.2%
Percent of Population that have Bachelor's Degrees or Higher
Housing
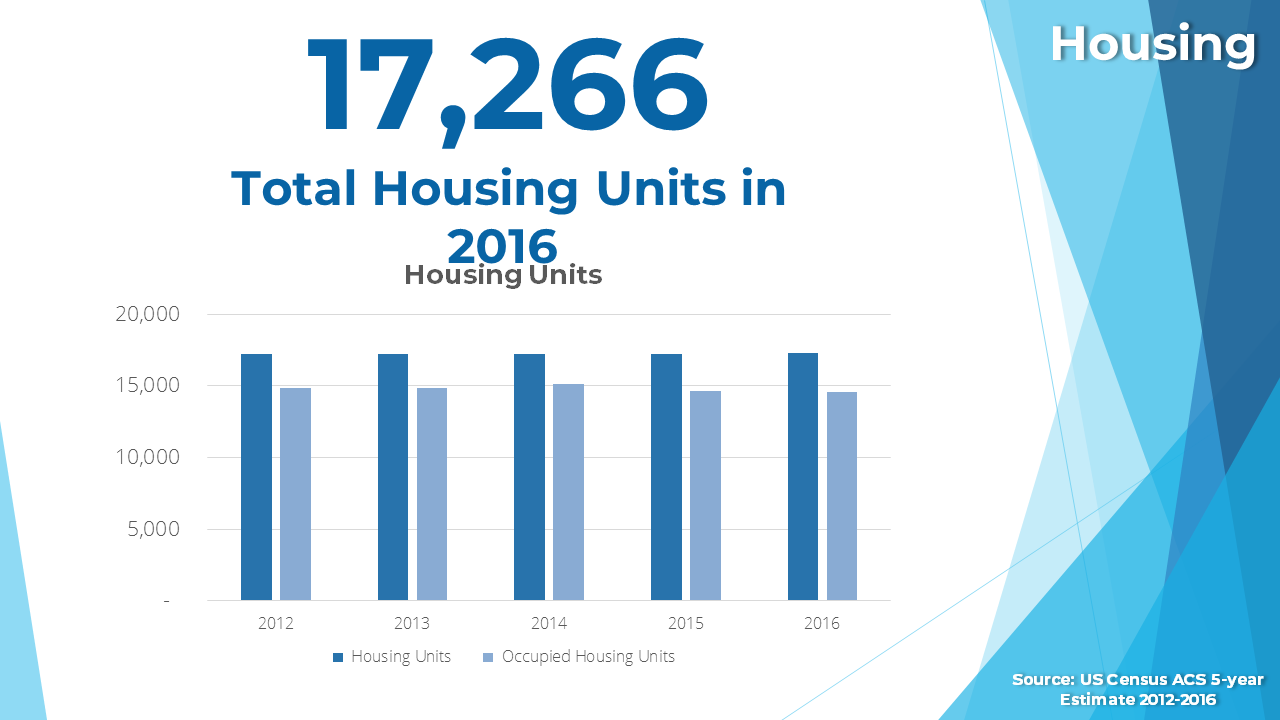
The median home value in Pulaski County is $136,700 and has increased by 6% since 2012. The total housing units in 2016 was 17,266. The number of total housing units in the County from 2012 to 2016 has remain approximately at 17, 200, while the number of occupied housing units for the same period has been around 15, 000 units.
Median Home Value
Median Home Value
$136,700
Median Gross Rent
$620
Economic Profile
Pulaski County median income increased from $43,072 in 2012 to $49,469 in 2016, a 14% increase. Similarly per capita income has been increasing and as of 2016 the per capita income is $25,738, while Virginia’s per capita income in 2016 was $31,798, which is slightly higher than Pulaski County.
14% Increase in Median Household Income from 2012 to 2016